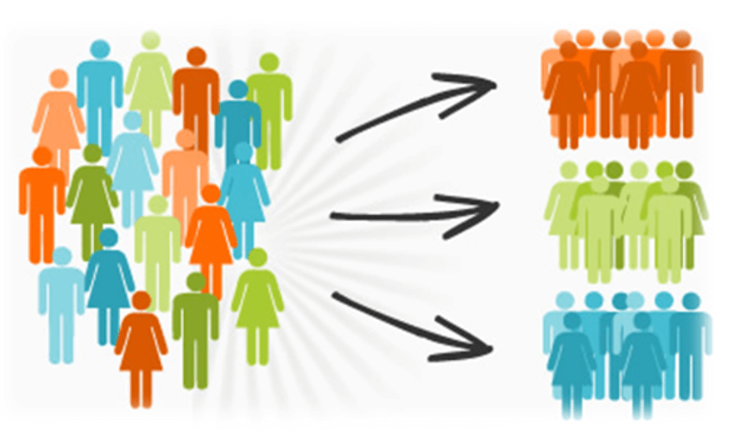
In Marketing Analytics, segmentation of customer data has many use cases: targeting groups of potential customers in marketing for acquisition, improving servicing standards to customers, enhancing customer relationships and identifying customer segments for retention strategies.
In addition, novel data sources lead to an increase in data complexity whilst providing a lever to usefulness of AI-ML techniques.
Clustering of customer data enables identifying groups of customers that are similar in relation to the variables considered. Different methods can be used to segment customers into groups. The purpose of segmentation is to identify suitable groups for customers, for instance with the aim to lever success of marketing channels when targeting chosen customer segments.
Disclaimer: The information is provided for mere information purposes as part of this blog. Auriscon Ltd and Auriscon HK Ltd assumes no responsibility or liability for any errors or omissions in the content of this site. The information contained in this site is provided with no guarantees of completeness and accuracy. No liability is assumed by Auriscon for any damages that may occur for external use of information provided herein.
Grouping Customer Data
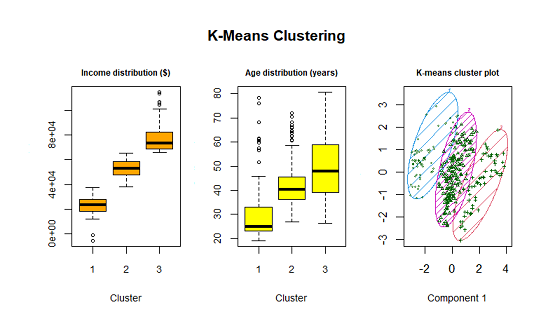
Clustering of customer data enables identifying groups of customers that are similar in relation to the variables considered. Different methods can be used to segment customers into groups. K-means clustering belongs to the standard statistical techniques, and determines segments by maximizing the distance between different group centers, and by minimizing the distance to the center within each group. Using fictitious customer data and subjecting to K-Means clustering, the outcome is displayed with respect to the Income variable below. Clustering is an unsupervised ML method with clusters being identified based on data alone.
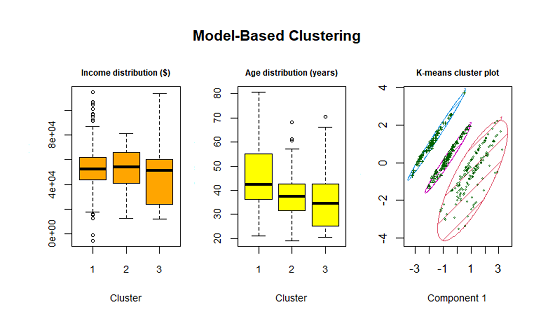
A minor caveat of K-Means is the requirement to choose the number of segments for clustering beforehand. Unlike K-Means clustering, Model-Based clustering, e.g. he R package mclust, does not require any advance specification of the number of clusters.
- The three segments obtained from the the K-Means and the Model-Based clustering methods differ for the sampled customer data. The suitabiliy of different cluster solutions has to be interpreted with view on the objective, i.e. for what purpose is the segmentation utilized.
Analyzing Customer Churn
 Customer churn occurs when customers stop doing business with acompany. Apparently, the impact of churn is negative, either through a loss of customers or through a loss of revenue. Before any data driven approach on analysis of churn data can start one has to have agreement within an organization on the definition of churn.
Definition of churn depends on the business model of companies: businesses that are subscription based encounter churn in terms of cancellations of subsriptions, whereas businesses that are based on recurring purchases encounter churn when customers refrain from buying any additional products or services for more than x months.
Understanding the drivers of churn is an important precondition before strategies to prevent churn can realistically be effective:
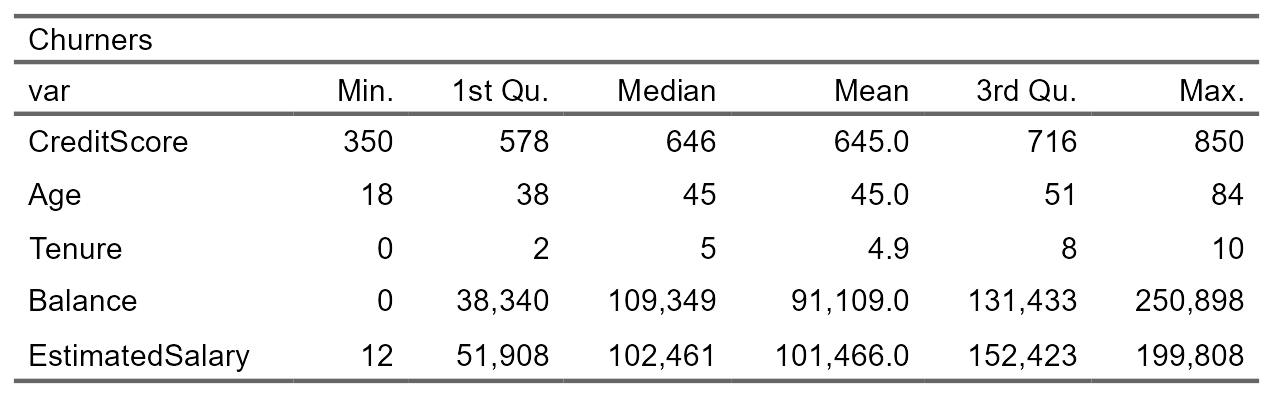
- Churn analysis is demonstrated on a dataset of 10000 Bank Churners obtained from Kaggle.


- Inspection of data reveals outliers for variables Age and CreditScore.
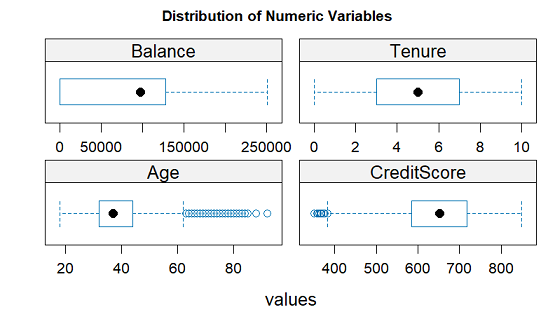
- The subset of churners in the data display central tendencies.
- For example, the churn rate of customers may vary by segment, dependent on the number of previous purchases. The data driven approach provides the rationale associated to critical segments with customers at higher risk for churn.
Predicting Customer Churn
Understanding the drivers of churn and predicting churn accurately are key requirements for a suitale Model. Choosing a suitable Model from different Model types is easier with awareness about important statistical methods available for prediction. Ensemble techniques in particular compare favourably to single Model techniques such as Logistic Regression. Techniques such a Random Forests and Gradient Boosting Trees provide often superior performance due to combining multiple trees within an ensemble in addition to accounting for non-linear relationships between variables.
Three Machine Learning methods are used for prediction of customer churn: (1) Logistic Regression which is a method commonly used for predicting binary outcomes. (2) Naive Bayes which is a classification method based on simplistic assumptions. (3) Random Forest which is a classification method that uses an ensemble approach to estimation.
-
Classification is different from Clustering: Clustering is an unsupervised ML method with clusters being identified based on data alone. By contrast, Classification such as Random Forest is performed supervised. The method trains the Model on the dependent variable in conjunction with the predictor variables. This results in a Model that can be used for prediction of class membership based on new data.
-
Random Forest approach use an ensemble of trees to arrive at robust estimators that avoid overfitting and work well on new data. For estimation, the data are split into training and test data sets with the Model being trained and validated on separate data sets. The Random Forests Model consists of a large number of trees with classifications for being assigned to the segment that receives the majority of votes from the ensemble. Noteworthy that for classification problems the dependent variable is of categorical type and is cast as a factor.
Ensemble techniques in particular compare favourably to single Model techniques such as Logistic Regression. Techniques such a Random Forests and Gradient Boosting Trees provide superior performance due to combining multiple regression or decision trees whilst accounting for non-linear relationships between variables. Other Supervised Learning methods such as Artifical Neural Networks (ANN) are similarly effective. In applicatons of ANN, multi-layer networks are typically used whereby the number of layers used increases until no further improvement in accuracy is detectable.